A solar scan, as you would receive it.
A simulated report for a 2,000-panel array: one morning of flight, 14 anomalies located, each with a position, a temperature delta and an action. The layout is the one our clients get as a PDF within 48 hours.
Drag to compare the two cameras.
The radiometric thermal camera sees what the eye cannot: hot cells, failed strings and dirty panels show up as temperature differences of a few degrees. Simulated overlay.
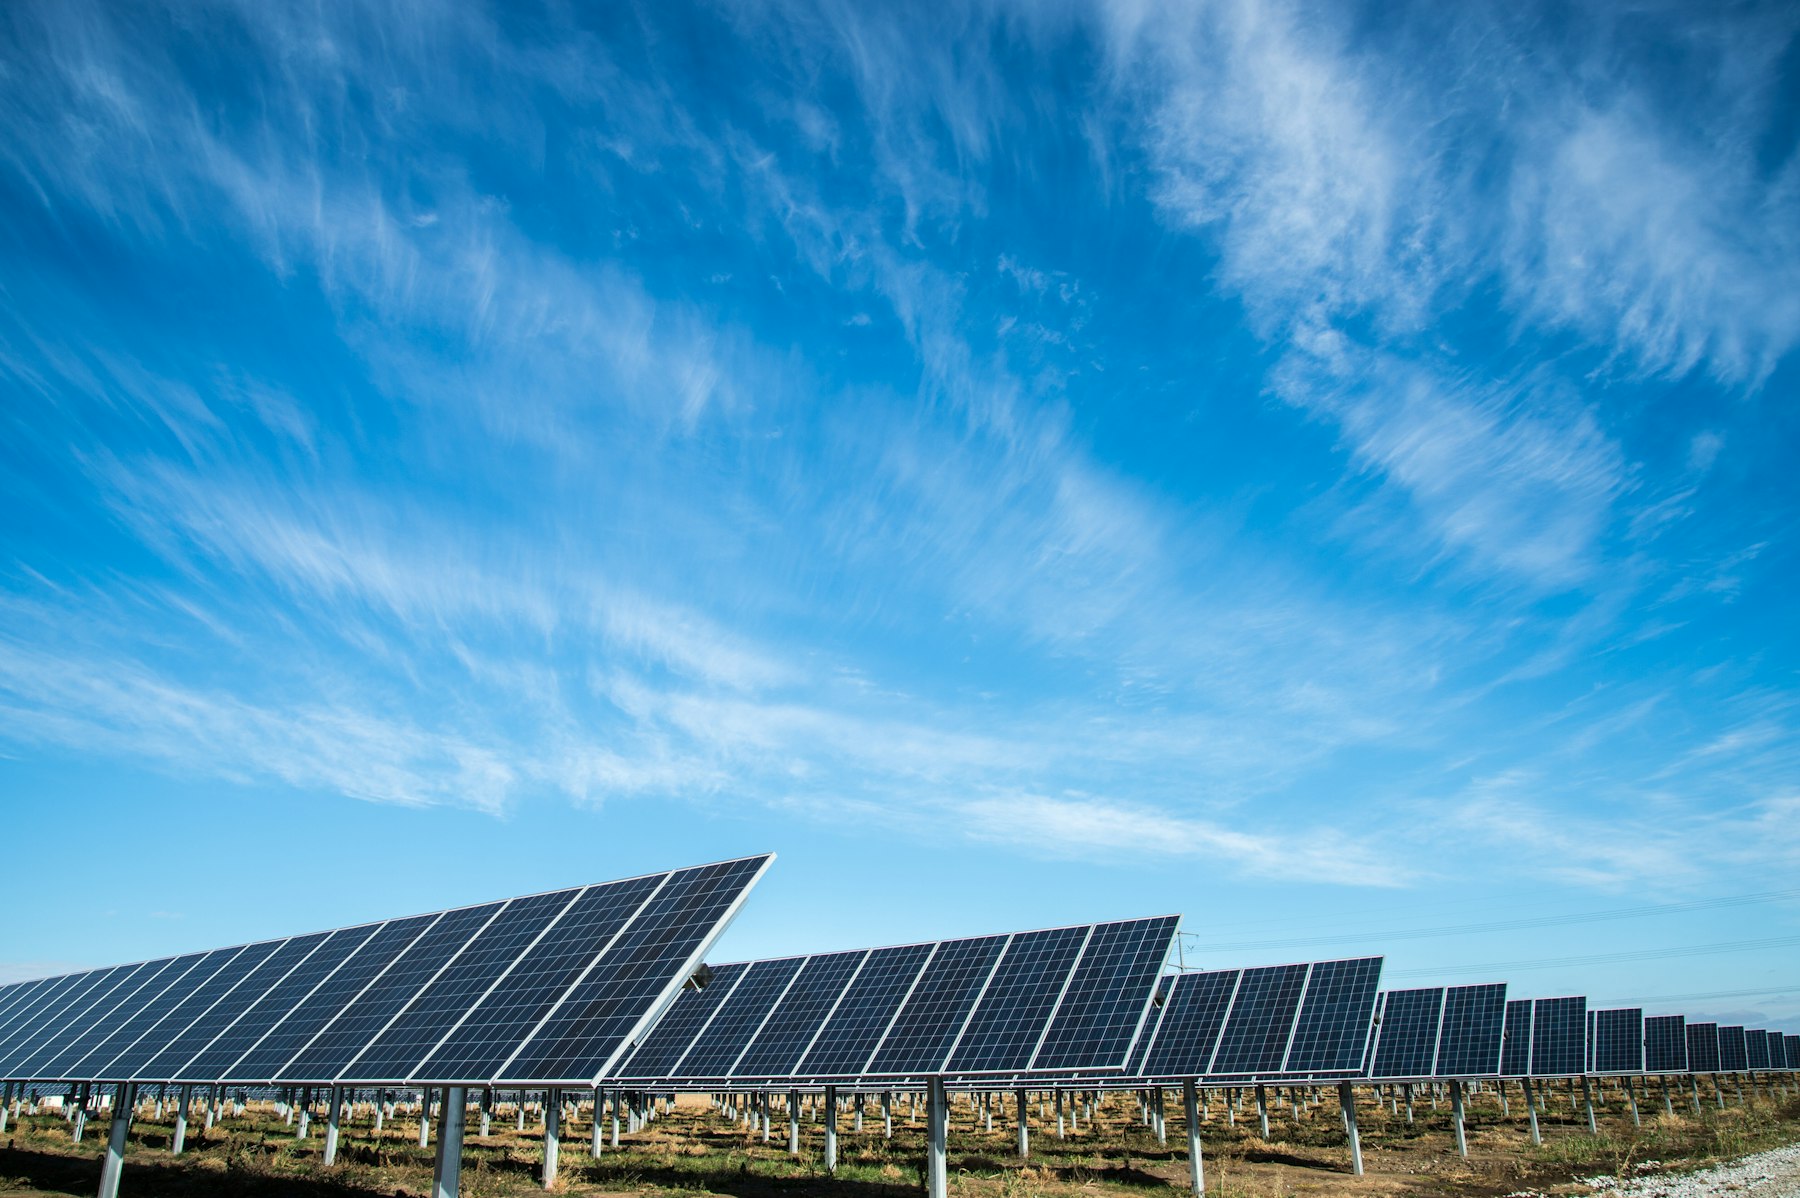
Every panel, every anomaly, located.
Hover or tap an anomaly on the map or in the list to see what the pilot found and what to do about it. Rows run top to bottom, panels left to right.
—
—
—
—
—
—
Simulated report. Positions, temperatures and losses are illustrative; a real scan delivers the same structure with your site’s data.
What is in the PDF.
Summary
Panels, anomalies by severity, estimated loss and the three repairs that pay for the scan.
Array map
The same map as above, printed, with every anomaly numbered.
Anomaly sheets
One page per anomaly: visual and thermal photo, GPS position, temperature delta, recommended action.
Orthomosaic
A georeferenced aerial map of the whole site, delivered as GeoTIFF and PDF.
Raw files
All thermal and visual frames, radiometric, yours to keep.
Get a flight plan for your site
Send us the address and what you need to see. We come back within 48 hours with a plan and a fixed quote.